

Sustainable Ecosystems
Under construction.
Climate and Emissions Dashboards built in partnership with the Teton Climate Action Partnership.
Sustainable Ecosystems
Dashboard
Interactive Ecosystems Data
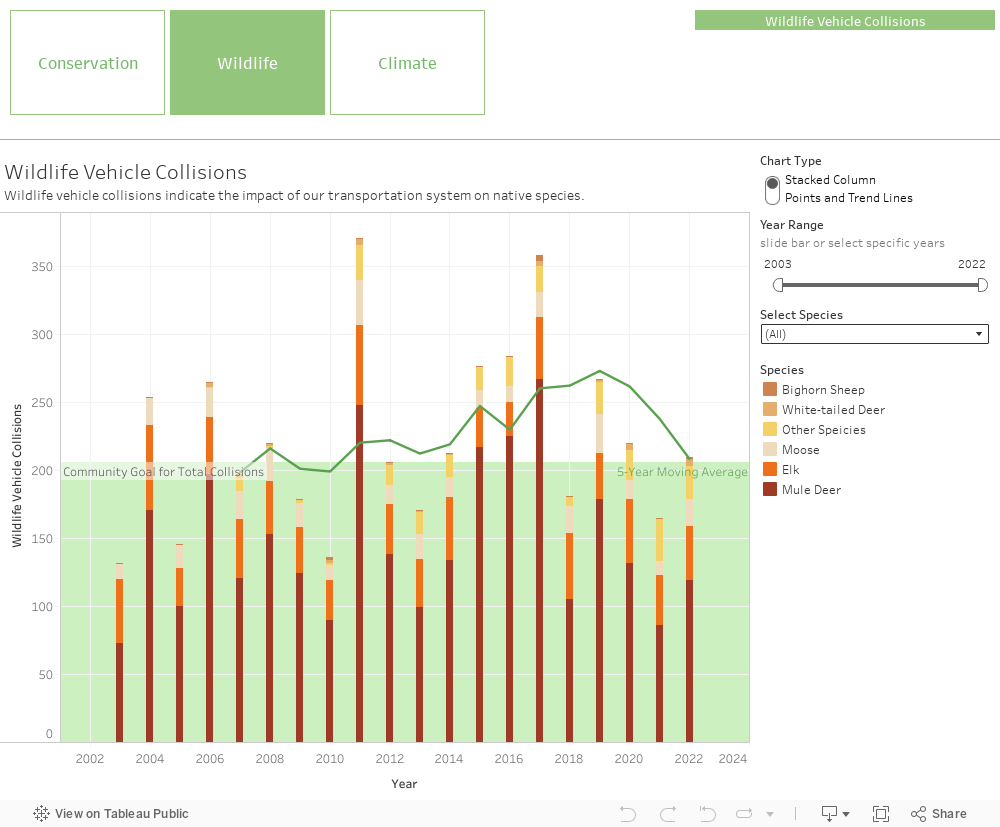
Use the interactive charts below to explore conservation, wildlife, and climate data in Teton County, WY. Use the toggles to look at past and present ecosystems data and compare across metrics. We recognize the importance of viewing this data in Spanish. Spanish-language access to this important tool is currently in development. This data is most easily accessible in desktop format.
Funding for Emissions and Climate dashboard construction provided by the Community Foundation of Jackson Hole. Funding for conservation and wildlife dashboards provided by Teton County, WY.

Beta Version Feedback
You are viewing a beta version of the Teton Community Wellbeing Dashboard. Many focus areas are currently under construction and others will be developed in the near future. Regardless of where they are in their development, each of the focus area dashboards are engaging in cycles of continuous improvement.
You are our community. Help us make this better! Each user brings a unique perspective to the dashboard. We value your participation and invite you to provide feedback on your user experience.